Expert Data Insights

Accurate analysis and clear interpretation for your research needs
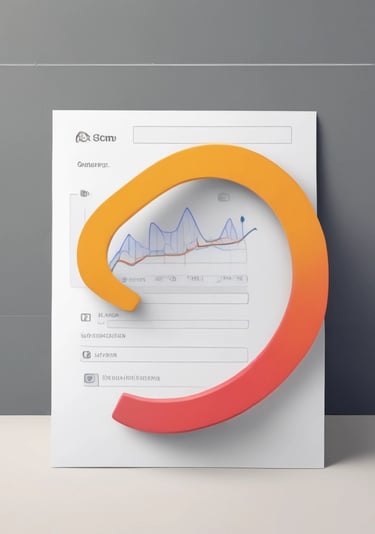
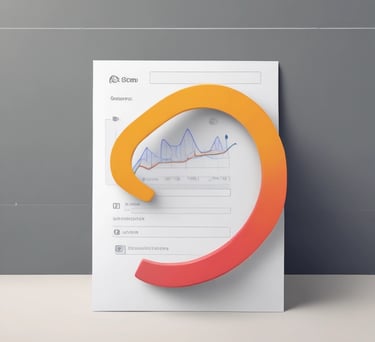
Analysis

Statistical analysis tailored to your data

R, Python, SPSS, MS-Excel

Support for academic thesis projects

Biostatistics expertise for health studies

Tools
Validation
Deep insights through advanced data analysis techniques.
A sleek dashboard displaying colorful graphs representing complex data patterns.
Regression Analysis

Uncover relationships between variables to predict outcomes.

Time Series

Analyze trends and cycles in data over time for better forecasting.

Multivariate

Explore complex interactions among multiple variables simultaneously.
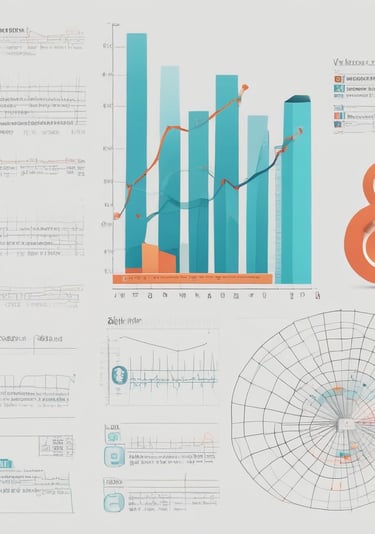
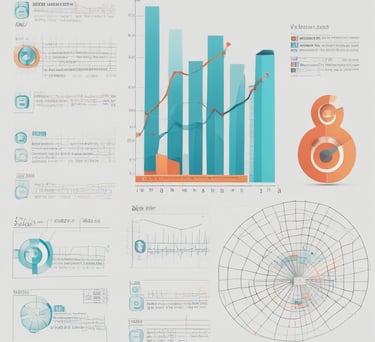
Data Visuals

Crafting clear plots like histograms, scatter matrices, and heatmaps.

A vibrant dashboard showing various colorful statistical plots including violin and box plots.
Distribution Plots

Histograms, density, violin, and box plots that reveal data spread.

Relationship Maps

Scatter matrices, pair plots, and heatmaps to show variable links.

Multivariate Views

PCA plots, dendrograms, and Andrews curves for complex data insights.

Who We Are

At datasense analytics, we turn complex data into clear, actionable insights with care.

A team of analysts collaborating over data charts and laptops in a bright, modern office.
Close-up of hands typing code and running statistical software on a laptop screen.
Visualization of colorful data graphs and charts displayed on a tablet in a meeting.

Our Promise

We pledge accuracy, expert interpretation, and secure delivery that you can trust every time.

Our Services

Expert data insights tailored to your research and business needs.

Statistical Analysis
A clean, modern graph showing statistical trends on a laptop screen.

Accurate data crunching with clear, expert interpretation.

Hands typing code in Python on a bright computer screen.
A researcher reviewing a detailed academic thesis with notes.
Thesis Support

Guidance through complex data for your academic success.

Survey validation and visualization that bring clarity.

Survey Services

Predict the future by creating it

Visualization and Analysis of Data

blue and white striped round textile
an abstract photograph of a curved wall
low-angle photography of blue glass walled building during daytime

Join Us

Stay updated with the latest analytics tips

Datasense Analytics made my thesis data clear and accurate, their expert insights truly boosted my research confidence.

Ravi K.

A professional headshot of a smiling man in his early 30s, dressed in business casual, against a soft blue background.

★★★★★

Contact

Reach out for expert data analysis help

© 2026 DataSense Analytics | Statistical & Data Analysis Services